

Introducing the Latest Enhancement in Rider 2024.1 EAP 4: The Integrated Monitoring Tool!


Exciting news for developers! In the latest Early Access Program (EAP) release of Rider, developers are introduced to the integrated monitoring tool, designed to provide real-time insights into their app's behavior as it runs. As a trusted reseller of JetBrains products, CodeOps is committed to equipping developers with cutting-edge tools that enhance productivity and streamline development workflows. Let's delve into the features and benefits of the Monitoring tool in Rider 2024.1 EAP 4:
The Monitoring Tool Window
Upon running or debugging a project in Rider, developers seamlessly encounter the Monitoring tool window, offering a centralized hub for tracking the app's performance and behavior in real time.
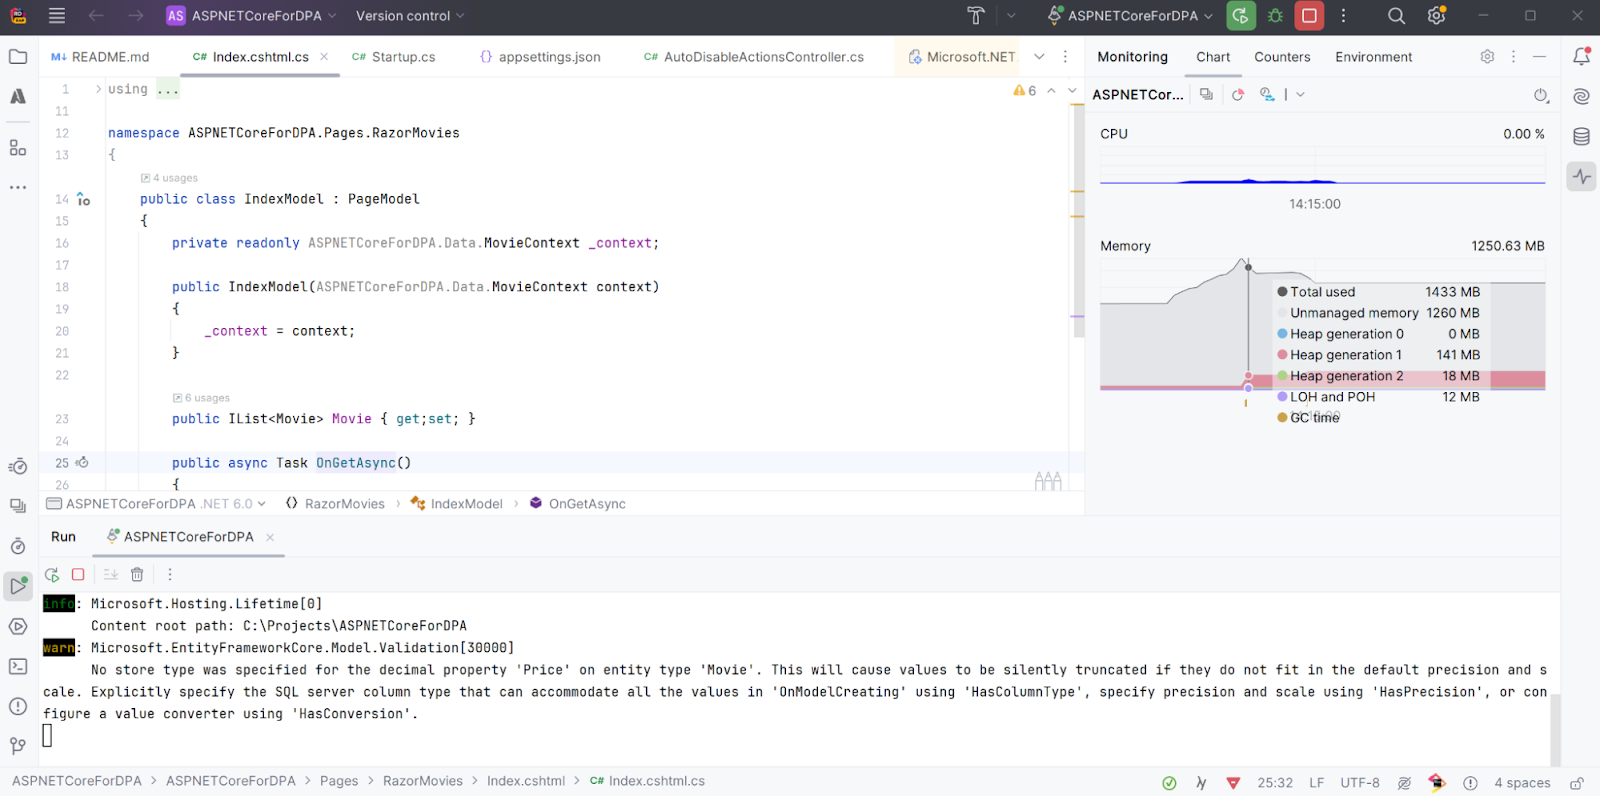
Image courtesy: JetBrains Blog
Effortless Profiling
With the new profiling capabilities, analyzing the project's performance has never been easier. With just a single click within the Monitoring tool window, developers can:
Access stack trace data effortlessly, aiding in the investigation of unexpected UI freezes or thread locks.
Obtain memory snapshots instantly to address memory usage spikes or frequent garbage collection events, without the need to initiate a separate profiling session.
Initiate performance profiling with ease, whether it's sampling or timeline profiling, and seamlessly open the data in the dotTrace Profiler.
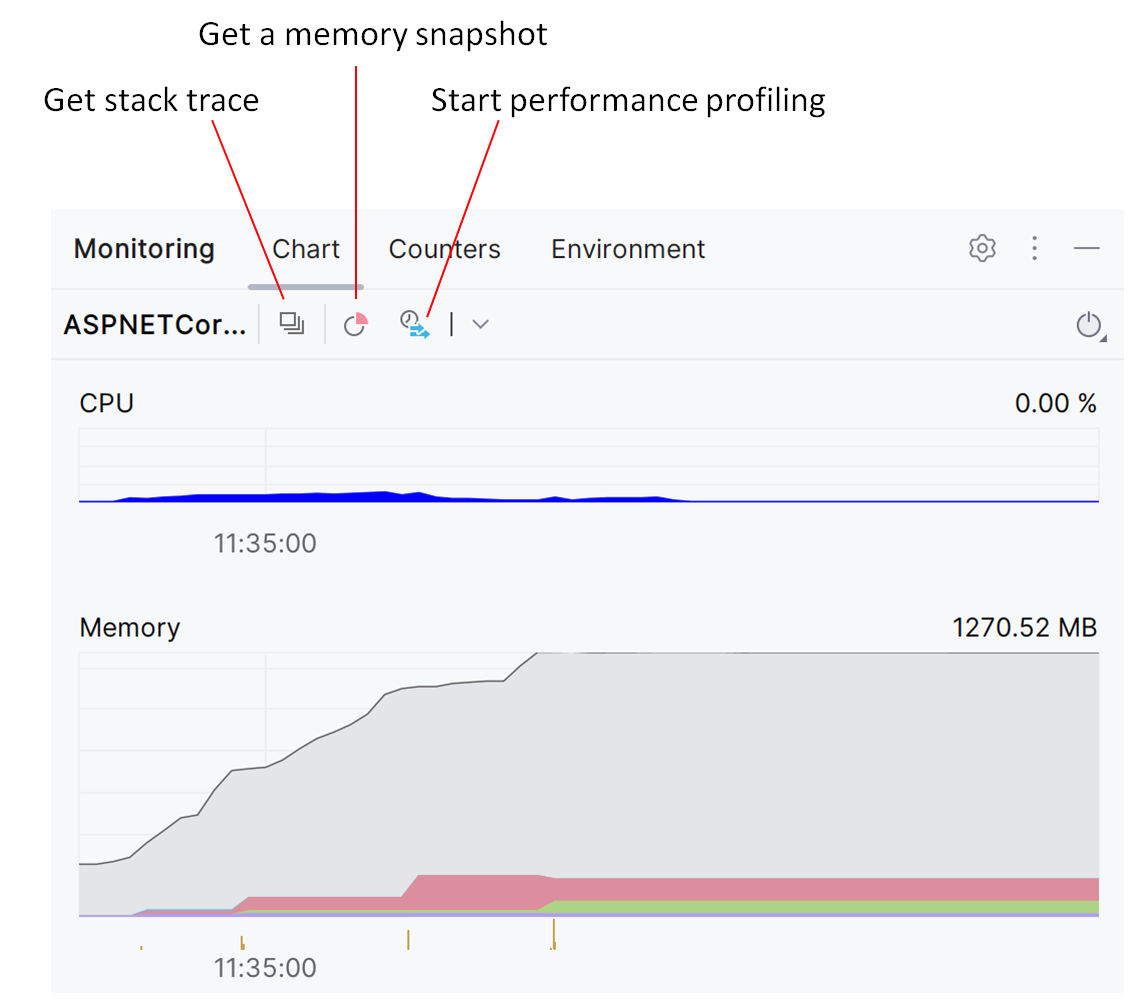
Image courtesy: JetBrains Blog
CPU and Memory Charts
Developers stay informed with real-time data displayed in the Chart tab, including
CPU chart showcasing CPU usage and application exceptions on the same timeline for comprehensive analysis.
Memory chart illustrating heap sizes and garbage collection events, facilitating efficient memory management.
Counters and Metrics
Valuable insights from various counter and metric providers are accessible via the Counters tab. Developers can customize the providers list in Settings to include metrics from libraries, enabling comprehensive monitoring tailored to the project's requirements.
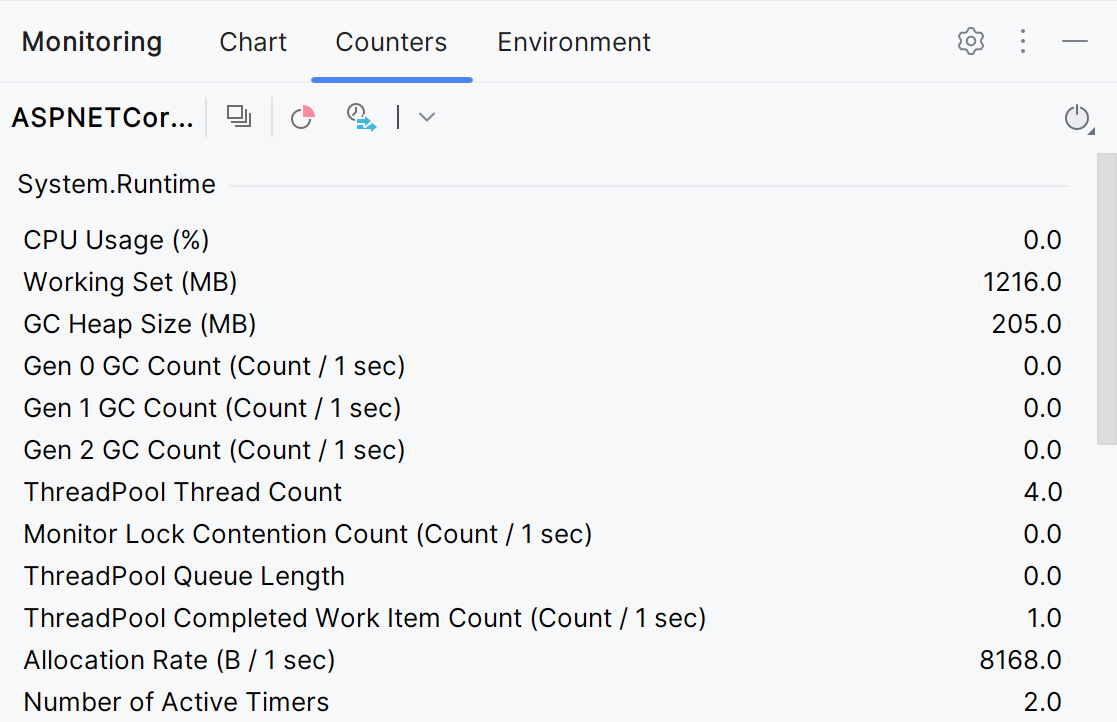
Image courtesy: JetBrains Blog
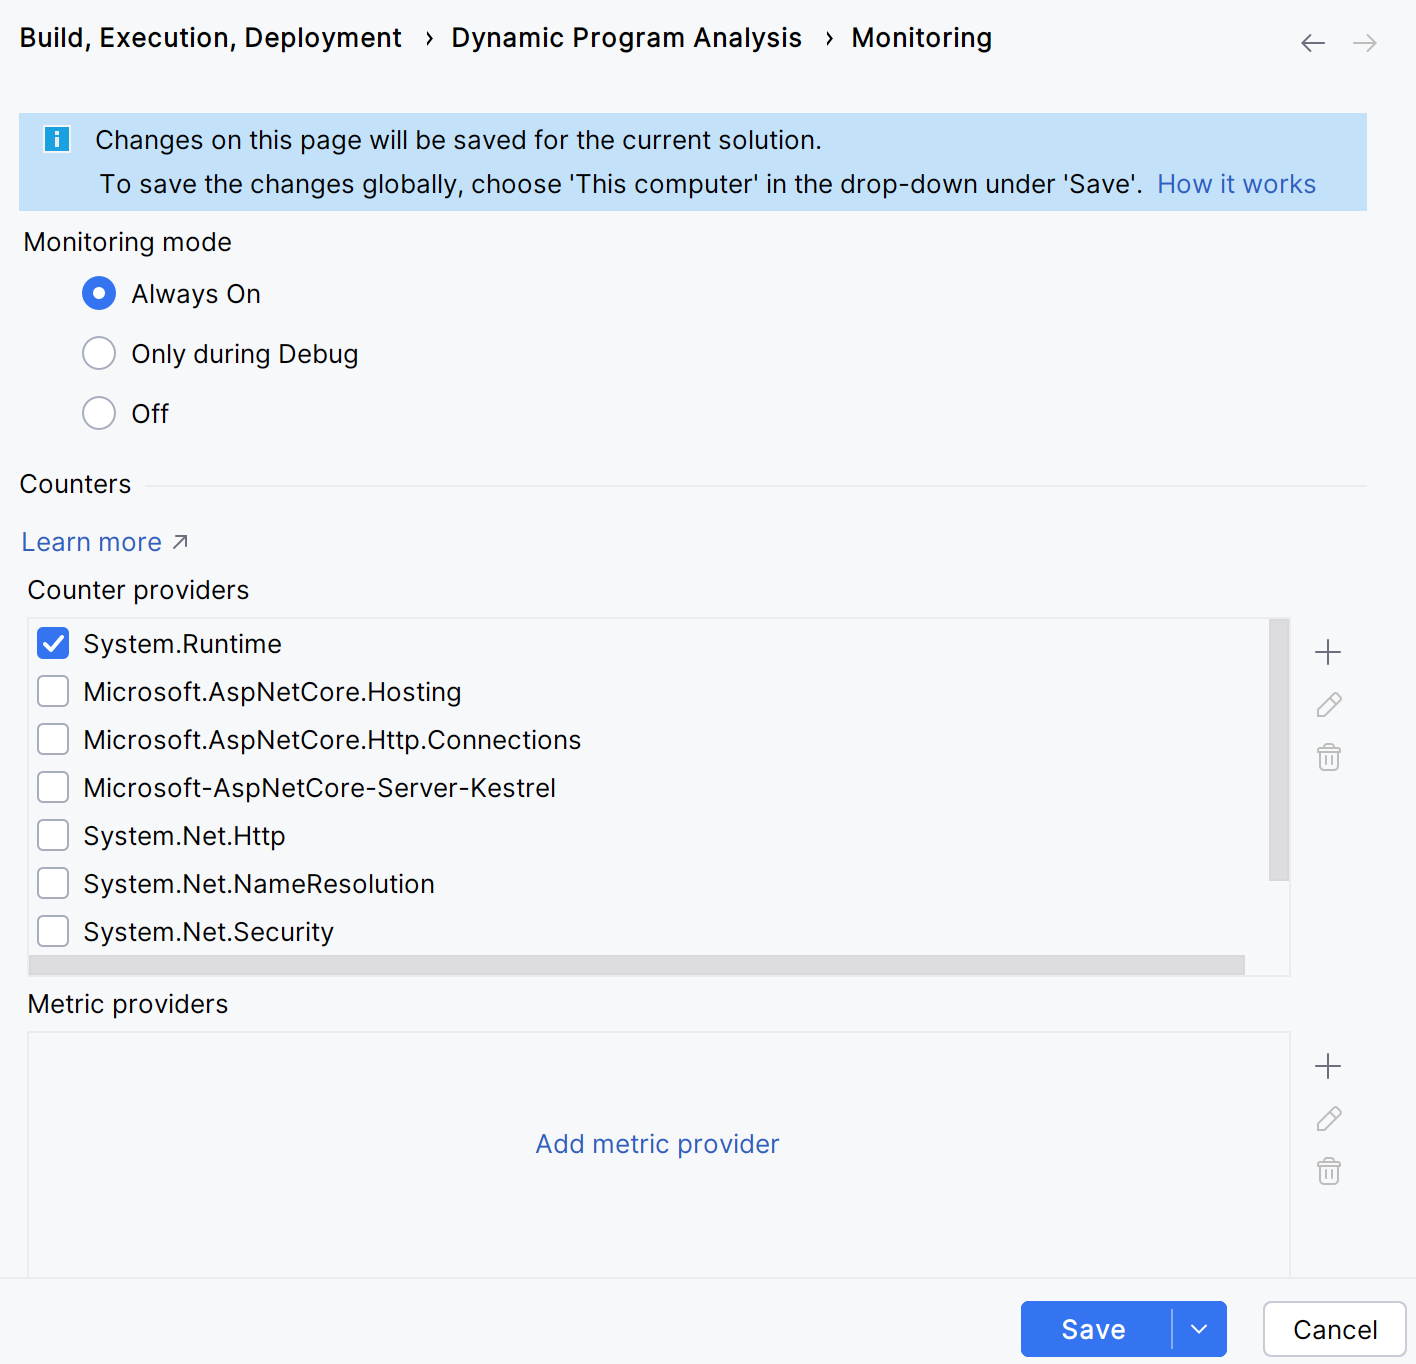
Image courtesy: JetBrains Blog
Environment Data
The Environment tab offers a comprehensive overview, from operating system details to environmental variable values, providing a holistic view of the app's runtime environment.
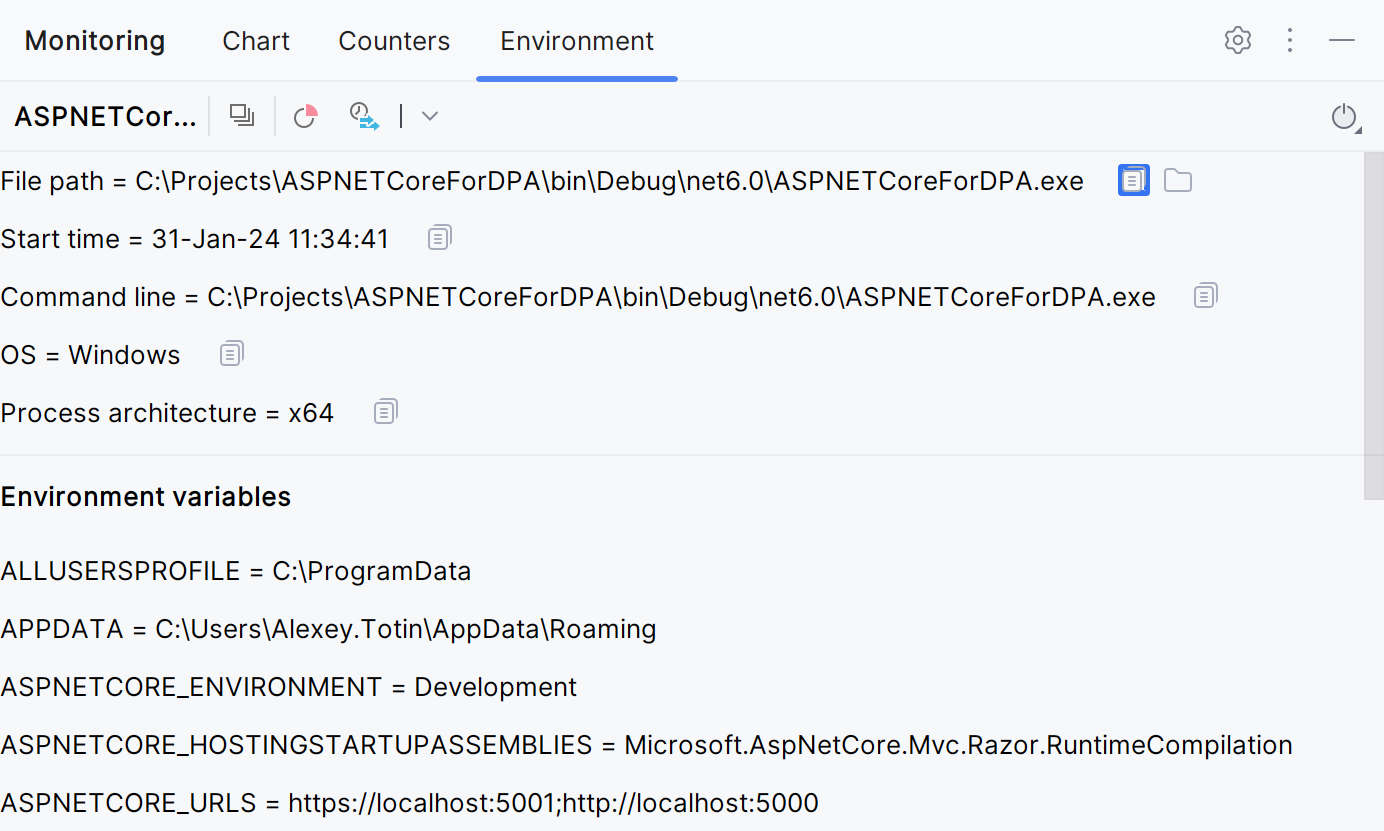
Image courtesy: JetBrains Blog
Flexible Monitoring Options
Developers can tailor monitoring preferences to suit their needs with the option to monitor all runs, debug sessions only, or disable monitoring entirely. Managing monitoring settings is effortless directly from the Monitoring tool window, with re-enabling monitoring just a click away via Settings.
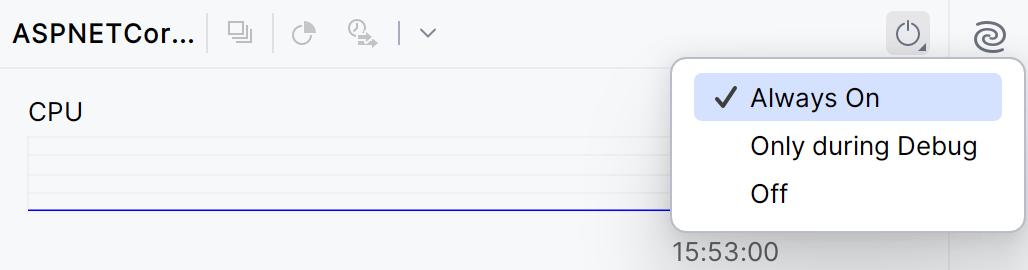
Image courtesy: JetBrains Blog
At CodeOps, developer feedback is highly valued. The introduction of the Monitoring tool window is a testament to the commitment to meeting the evolving needs of the developer community. The team eagerly anticipates input on how to further enhance this feature to better serve development endeavors.
In conclusion, the integrated Monitoring tool in Rider 2024.1 EAP 4 represents a significant stride towards empowering developers with unparalleled insights into their app's performance. Developers are encouraged to experience the convenience and efficiency firsthand by incorporating this groundbreaking tool into their development toolkit today. Share thoughts and suggestions in the comments below – feedback drives continuous improvement efforts!
Explore licensed JetBrains products and revolutionize development workflows with CodeOps! Refer to JetBrains blogs for more product updates.